
Tracking down sound sources in fans is not an easy task. Whereas relatively advanced aerodynamic simulation programs are now available and have become established on the market, the simulation of aeroacoustics is still very much at the research stage. The number of cells needed for the required spatial resolution of small turbulent structures is far higher than in the case of aerodynamic simulation. For a fan in particular flow situations the figure may even be as high as tens or hundreds of millions.
Another necessity is high time resolution – typically with intervals of around 10 microseconds. This demands great computational resources and the associated time and financial outlay. That explains why, in the case of fans for example, only the larger turbulent structures (of relevance to acoustics) are resolved. Even with these limitations the outlay is considerable, and work is currently in progress to find ways of reducing the amount of computational work involved. Experimental processes are helpful in this regard.
Beamforming with microphone array
One example of an experimental method of localizing sound sources on a rotating fan used by the ebm-papst motor and fan specialists to supplement complex aeroacoustic simulation is the so-called beamforming process. At the heart of this is a circular microphone array (Fig. 1) with 80 microphones arranged on two levels.


The microphone array is used on the intake side of the fan test stand to measure the differences in propagation time of the sound waves to each of the microphones. Sophisticated algorithms then evaluate the data obtained over a period of 30 seconds at a known fan speed. The results show that the beamforming method detects the same trends as aeroacoustic simulation (Fig. 2). The experimental findings thus also permit checking and optimization of the numerical simulation. For localizing sound sources ebm-papst uses the so-called beamforming process as a supplement complex aeroacustic simulation.
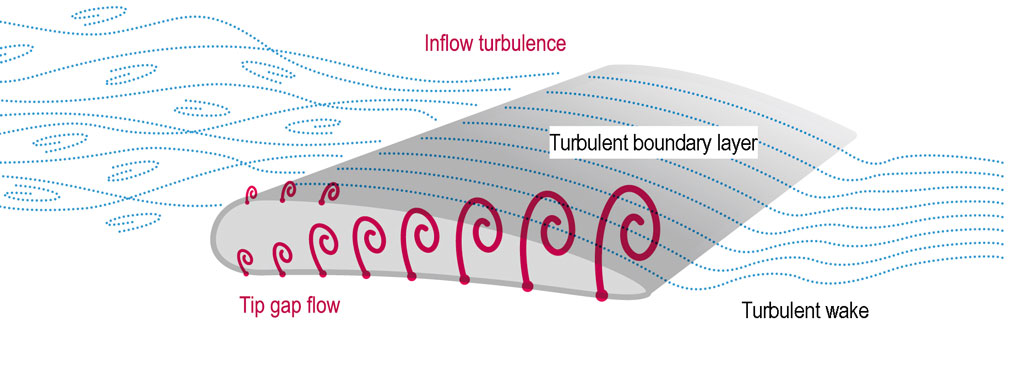
The evaluations reveal two dominant sources of noise for a typical axial fan: the tip gap flow between blade and fan housing and the so-called inflow turbulence (Fig. 3). At the tip gap, the difference in pressure between the outlet and intake sides causes air to flow over the fan blades at the blade tip. The flow interacts with the edges present there, in other words the blade surface and the surrounding housing wall. Vortices form which can increase the sound level by up to 10 dB on separation.

Inflow turbulence is particularly an issue when the fan is enclosed. A box such as those used for heat exchangers, for example, was chosen for testing with the microphone array. Backflow areas with corresponding circulation, in other words air turbulence, occur at the housing walls. This is then drawn towards the points at which the gap between fan and housing wall is at its narrowest. The turbulence from both sides merges here.
These “vortex strings” then produce great turbulence (Fig. 4). As a result, considerable fluctuations in pressure and velocity occur at the front edge of the blade, resulting in sometimes dramatic additional noise in the low-frequency range in particular. This takes the form of both broadband noise and narrow band tonal sound components, also known as blade passing noise. Everyone has at some point come across the unpleasant “humming” noise typical of this.
From finding the cause to tackling the noise
Once the sources of noise have been localized, action can be taken to improve the aeroacoustics of the fans: The size of the gap between the blade tip and fan housing was found to have a considerable influence on noise behavior. The noise level decreases with a smaller gap, but production-related necessities mean that the gap dimension cannot be reduced beyond a certain point because of the risk of the blade tip catching on the fan housing.
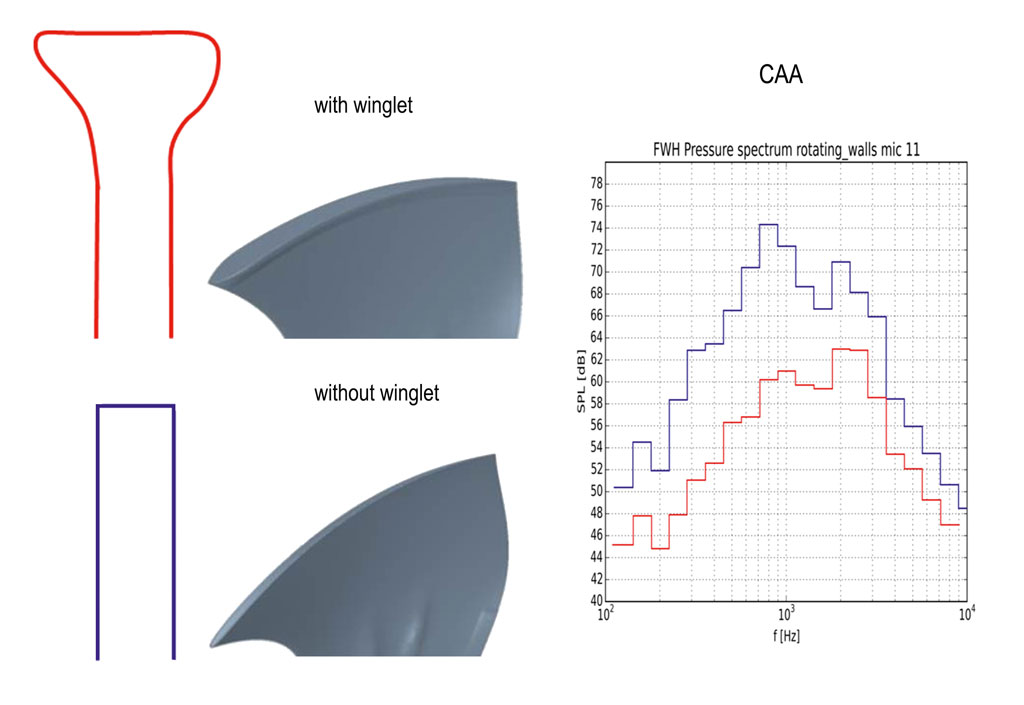
This is where winglets can help. These curved end caps added to the blade tips influence the tip gap flow and the vortices that form and so significantly reduce the noise level (Fig. 5). This has a positive effect on the tip gap flow, thus reducing the interaction of the flow with the edges. The sound power drops by up to 10 dB as a result.
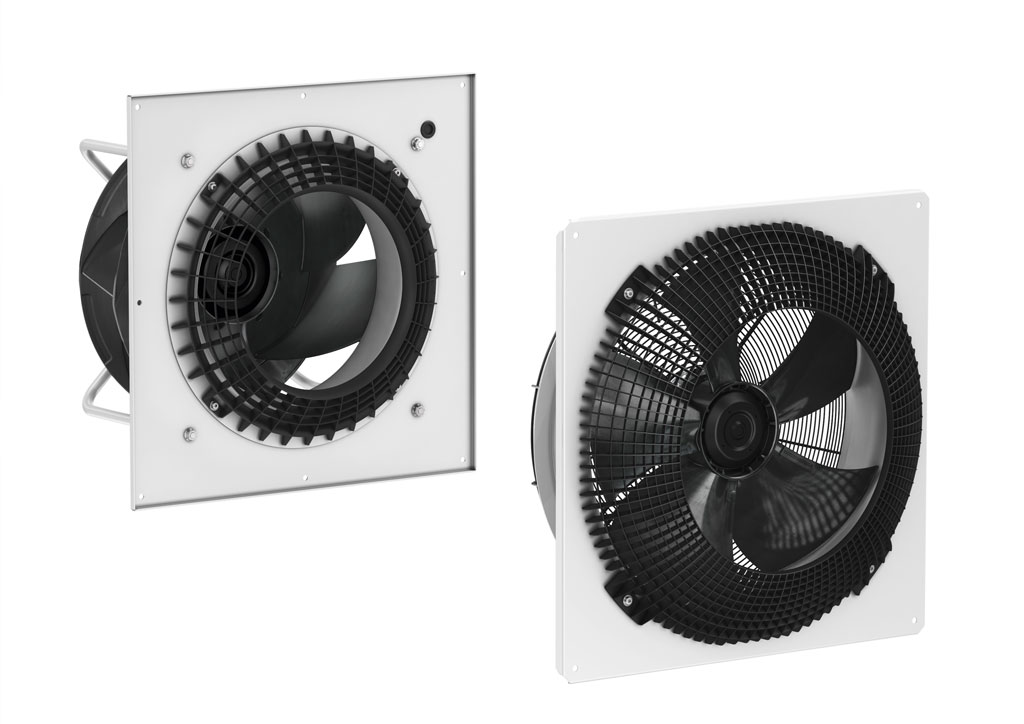
Geometric modifications to the fan alone are however not sufficient to reduce the inflow turbulence, as this results from the installation situation. Additionally insulating the housing tends not to be particularly successful either, as the insulation panels used normally only take effect as of higher frequencies. A different approach is more promising: Improving the inflow of air to the fan lessens turbulence and thus also the annoying low-frequency noise it generates. For this purpose ebm-papst has developed a special air inlet grill (FlowGrid) that acts like a flow straightener on the intake air. It thus dramatically reduces noise-generating disturbance in the inflow and is equally effective with both axial and centrifugal fans (Fig. 6).
Regardless of the structural conditions and the installation situation in the housing, the fans then attain noise values comparable with those for operation under laboratory test conditions. Aeroacoustic testing has thus proven its worth as a means of optimizing fans. It will be interesting to see what the future holds in store. One thing is certain, energy-efficient fans from ebm-papst will become even quieter still.
Soundcheck for heatpumps: Psychoacoustics for minimum noise generation
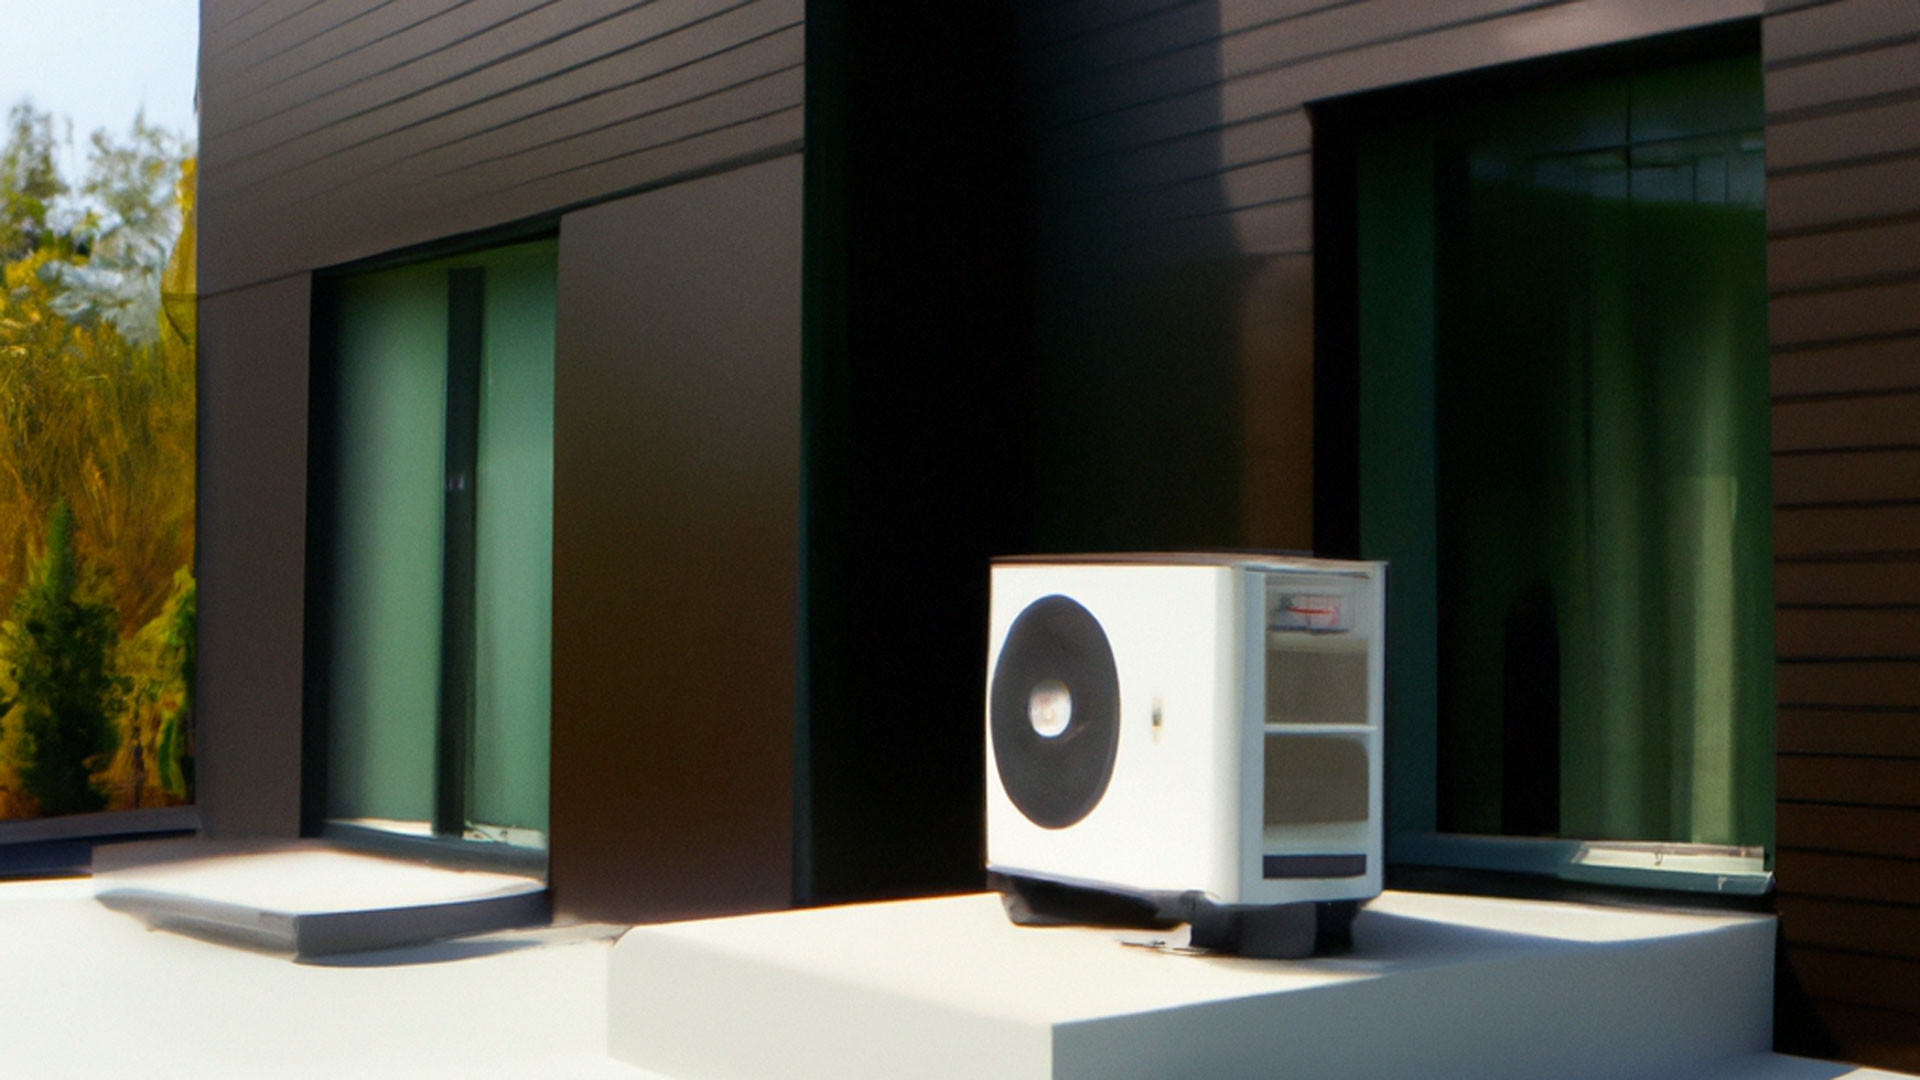
Air/water heatpumps with heat outputs from 3 to 30 kW enjoy a high level of acceptance in heating technology. However, they do not work completely silently. It is by no means just the measurable sound pressure level that is crucial, but human noise perception, which is where psychoacoustics and its examination methods come into play.
“Numbers alone say nothing”
The level of noise emissions is a decisive quality factor for fans. Dr Marc Schneider, ebm-papst’s Group Leader for Acoustics, explains how the company keeps its products quiet
At what point is fan noise perceived as disturbing?
That is not an easy question to answer. There are of course physical characteristics like the noise level that you can measure on a test bench. But numbers alone often say nothing about how the human ear perceives this kind of noise. For a subjective assessment, what is important is how “raw” the noise is perceived. This perception can happen when the signal is given a temporal structure through a change in the frequency or amplitude.

A lot of noises also have tonal components which can be extremely disturbing.
Dr. Marc Schneider, Leader for Acoustics ebm-papst
A lot of noises also have tonal components which can be extremely disturbing. This perception differs from person to person, which makes assessment even more complicated. One person reacts negatively to low-frequency noises, another winces at higher-frequency noises.
How do you measure this personal perception?
At ebm-papst, we have the “AudiMax”, a so-called psychoacoustic laboratory. In this noise-insulated facility, we have space for up to eight test listeners to whom we can play the noises of our products in different configurations.
How does this method help achieve usable results?
After hearing the noises, our staff ask the test subjects about how they perceived them and thus create a database with scientific considerations. Using this database, we can evaluate together with our colleagues from production which measures need to be taken and which not. Our overall aim is to create a fan that is perceived as comfortable by as wide a spectrum of test subjects as possible.
Sound effects
Analyzing noise to provide figures relating to physics and people.
A product’s quality in terms of its sound emission is usually determined by its dB(A) value, which refers to the sound pressure level generated by an acoustic source at a certain distance. Depending on the level of the alternating pressures from which the sound pressure level is determined, exposure to noise can cause effects ranging from slight reductions in mental performance to pain and even unconsciousness.
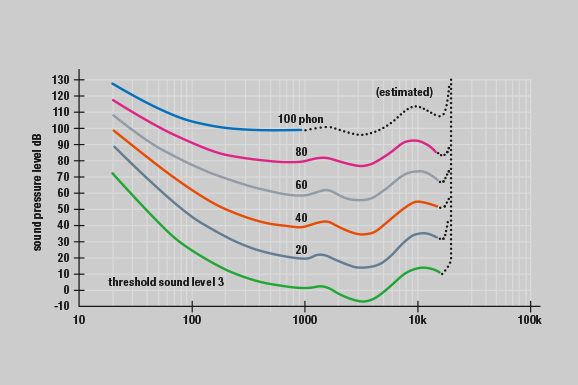
The concept of dB(A) also includes a means of assessing acoustic measurements to help answer the question, “How does noise affect people?” This question has kept scientists busy for decades and is now of increasing interest to engineers. For example, the following findings have been compiled in psychoacoustic studies: For physiological reasons, humans do not perceive every frequency equally. Figure 1 shows the results of hearing experiments with tones of different frequencies. The curves show, depending on frequency, what sound pressure level is needed in order to be perceived uniformly by humans. This is called loudness.
Perception of noise levels
The human ear is capable of perceiving acoustic waves of very different amplitudes. At a frequency of 1 kHz, the hearing threshold is about 20 µPa; the pain threshold is approx. 64 Pa.
The dB scale was designed as follows to allow visualization of this very high dynamic range:
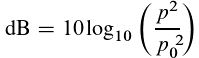
where p0 = 20 µPa and p2 represent the energy of the acoustic signal.

This diagram provides a number of insights. For one thing, it can be seen that the human ear is most sensitive in the range between two and four kilohertz. Much higher or lower frequencies are perceived as quieter, even at the same sound pressure level. It can also be seen that this characteristic of hearing is not only dependent on loudness. The isophone at 40 phon was used for the dB(A) weighting (Figure 2). In addition to dB(A), there are other frequency weighting methods. For example, dB(C) has been proposed as a better alternative for high sound pressure levels. The dB(D) weighting has become established for aircraft noise.
The dB(A) value and its reduction from one product generation to the next are sales arguments for industrial products. This is insufficient when the effect of noise reduction on people is determined by a significantly different perception than that of pure loudness. For example, other research has shown that a noise reduction of approximately ten dB(A) is perceived as a halving of the loudness.
Examples of noises, in dB(A)
- 160: Rifle shot near muzzle
- 130: Jet fighter at distance of 7 m
- 120: Airliner at distance of 7 m
- 110: Private aircraft at distance of 7 m
- 100: Circular saw
- 90: Car at 100 km/h at distance of 1 m
- 80: Car at 50 km/h at distance of 1 m
- 70: Lawn mower
- 60: Normal conversation, car at distance of 15 m
- 50: Quiet radio music
- 40: Humming refrigerator
- 30: Whispering
- 20: Dripping water faucet
- 10: Rustling leaves in forest
- 0: Defined threshold of hearing
Leave a comment