
A product’s quality in terms of its sound emission is usually determined by its dB(A) value, which refers to the sound pressure level generated by an acoustic source at a certain distance. Depending on the level of the alternating pressures from which the sound pressure level is determined, exposure to noise can cause effects ranging from slight reductions in mental performance to pain and even unconsciousness.
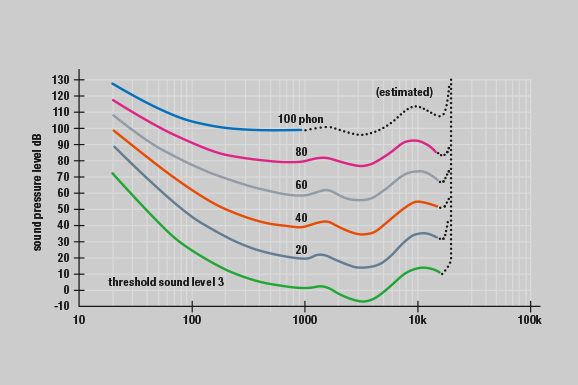
Fig. 1: The curves show how much sound pressure is needed so that humans perceive sound uniformly.
The concept of dB(A) also includes a means of assessing acoustic measurements to help answer the question, “How does noise affect people?” This question has kept scientists busy for decades and is now of increasing interest to engineers. For example, the following findings have been compiled in psychoacoustic studies: For physiological reasons, humans do not perceive every frequency equally. Figure 1 shows the results of hearing experiments with tones of different frequencies. The curves show, depending on frequency, what sound pressure level is needed in order to be perceived uniformly by humans. This is called loudness.

Fig. 2: Curves of equal loudness level — isophones (ISO 226:2003)
This diagram provides a number of insights. For one thing, it can be seen that the human ear is most sensitive in the range between two and four kilohertz. Much higher or lower frequencies are perceived as quieter, even at the same sound pressure level. It can also be seen that this characteristic of hearing is not only dependent on loudness. The isophone at 40 phon was used for the dB(A) weighting (Figure 2). In addition to dB(A), there are other frequency weighting methods. For example, dB(C) has been proposed as a better alternative for high sound pressure levels. The dB(D) weighting has become established for aircraft noise.
The dB(A) value and its reduction from one product generation to the next are sales arguments for industrial products. This is insufficient when the effect of noise reduction on people is determined by a significantly different perception than that of pure loudness. For example, other research has shown that a noise reduction of approximately ten dB(A) is perceived as a halving of the loudness.
For the continued improvement of our products, these issues cannot be neglected. This was one of the reasons for building the “Kombikanal,” a test stand at our St. Georgen location for combining air performance and acoustic measurements for fans to enable acoustic and psychoacoustic analyses of the products.
Perception of noise levels
The human ear is capable of perceiving acoustic waves of very different amplitudes. At a frequency of 1 kHz, the hearing threshold is about 20 µPa; the pain threshold is approx. 64 Pa.
The dB scale was designed as follows to allow visualization of this very high dynamic range:
![]()
where p0 = 20 µPa and p2 represent the energy of the acoustic signal.
Examples of noises, in dB(A)
| 160 | Rifle shot near muzzle |
| 130 | Jet fighter at distance of 7 m |
| 120 | Airliner at distance of 7 m |
| 110 | Private aircraft at distance of 7 m |
| 100 | Circular saw |
| 90 | Car at 100 km/h at distance of 1 m |
| 80 | Car at 50 km/h at distance of 1 m |
| 70 | Lawn mower |
| 60 | Normal conversation, car at distance of 15 m |
| 50 | Quiet radio music |
| 40 | Humming refrigerator |
| 30 | Whispering |
| 20 | Dripping water faucet |
| 10 | Rustling leaves in forest |
| 0 | Defined threshold of hearing |
Leave a comment